The purpose of this test was to quantify the aero loads we are seeing on the evos we time trial and road race. There are obvious reasons to utilize aero on our race cars, but actual numbers of how effective these components may be are nearly non-existent. CFD results for a wing are great to have, but put behind the turbulent flow of the roof of the car, we would expect the real world results to differ. In the US, road racing and Time Trialing is largely grassroots so you don’t see big budget teams, and even fewer people instrumenting their cars. The few pro teams there are, keep their data to themselves as a advantage over their competitors (rightly so).
For those who don’t understand the science behind why downforce helps cars handle better, we begin at the tire. Friction between the tire and the road is what gives you the grip when cornering. This force of friction (Ff) is defined as Ff = Fn*mu, where Fn is the normal force and mu is the coefficient of friction. The coefficient of friction changes with tire compound, temperature, track surface tire pressure etc. For the purpose of simplicity, we are going to assume mu is a constant that never changes, and we are going to ignore slip angles, tire compounds, tire size etc.
The Fn value is the parameter we are playing with when it comes to aerodynamics. The normal force is the load on the tire, and as you can see by the equation, if you assume mu is constant, if you increase Fn, your Ff increases (and thus lateral grip). Its also true that if you make your car heavier, you increase the grip the tires have. There are downfalls to making your car heavier though, the first being when you look at the lateral loads needed to make a corner , with a heavier car the loads are greater (F-=m*a, where m is greater, F needs to be greater as well for the same a), therefore it takes more Ff to maintain the same lateral load as a lighter car. Make your car light, with a lot of downforce, you increase its Force of friction with the road, but don’t increase the mass for the cornering acceleration, this means greater cornering speeds.
So moving forward, we wanted to show the actual loads seen on the car by the various wings, splitters and diffusers people utilize in our sport. The first tests we conducted were more of a proof of concept of how we are measuring the loads. We outfitted the car with 4 linear potentiometers in parallel with the springs on the car. We next measured the actual spring rates of the springs. This would give us a spring load in lbf relative to the travel in inches of the potentiometers. The spring rates we measured for this test were 653lb/in for the front shocks, and 544 lb/in for the rear shocks. We know that there is not a 1:1 correlation between the spring load and the actual load on the wheel but we haven’t measured the motion ratio and spring angle yet to determine that factor.
For our aero test, we wanted to show what effect we will see at our normal race speeds. Typically, we don’t ever see cornering speeds over 100mph here in Texas, with most corners being in the 40-80mph range. We conducted the test by driving at a steady state speed measured and recorded by GPS for 1.5km in one direction, made a u-turn and came back 1.5km in the opposite direction. We tested the car at 40-60-80-100mph.
We started our testing with no wing or splitter on the car. This gives us a baseline of the natural spring load with no aero. Interestingly, in this case we weren’t able to measure any noticeable lift or downforce from the car. The ride height averages over all of the test speeds were within our range of error.
The first test we conducted was with the rear wing by itself. For this test, it was conducted at 30-60-90 before we expanded the number of test points. The results were good, showing how well an APR GTC-300 wing at max AoA can do on an evo.

When you account for the front wheels lifting slightly (and or weight transfer from the rear springs compressing more, and a torque generated from the drag), the loads show the wing makes a net downforce on the car of 61lbs@60mph and 161lbs@90mph.

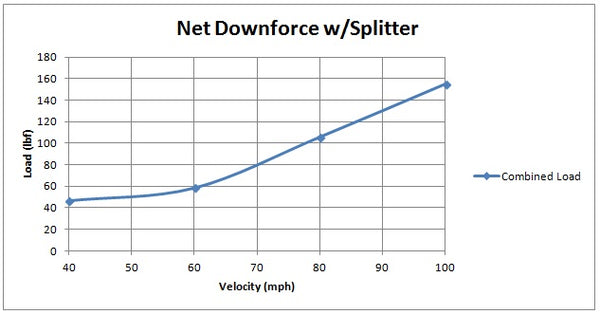
Moving on to our second test, we took the wing back off, and added the front splitter. For this test, we used the 40-60-80-100 test speeds. We were amazed by the results here, with the front splitter generating a net 154lbs at 100mph.

With both our Splitter and wing tests done individually, we would expect to see 300+lbs of downforce on the car at 100mph. we bolted the wing back on and conducted the tests.


So indeed we did see the total downforce exceed the 300lb, with it actually being 344lbs.
With the car weighing 2900lbs with the driver, we theoretically should see .12G more through corners by adding the wing and the splitter at 100mph.
